axis
Set axis limits and aspect ratios
Description
axis uses a
predefined style to set the limits and scaling. For example, specify
the style as styleequal to use equal data unit lengths
along each axis.
axis sets whether MATLAB® automatically
chooses the limits or not. Specify the mode as modemanual, auto,
or one of the semiautomatic options, such as 'auto x'.
axis , where ydirectionydirection is ij,
places the origin at the upper left corner of the axes. The y values
increase from top to bottom. The default for ydirection is xy,
which places the origin at the lower left corner. The y values
increase from bottom to top.
axis , where visibilityvisibility is off,
turns off the display of the axes background. Plots in the axes still
display. The default for visibility is on,
which displays the axes background.
Examples
Set Axis Limits
Plot the sine function.
x = linspace(0,2*pi);
y = sin(x);
plot(x,y,'-o')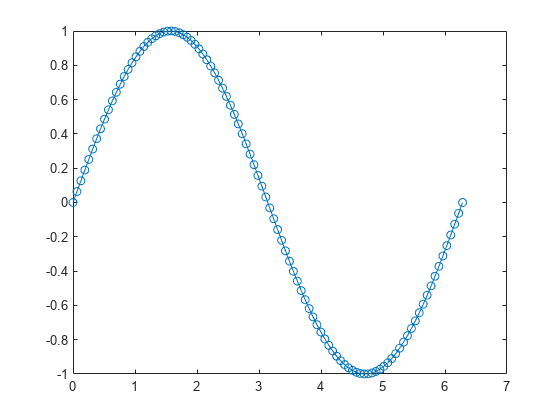
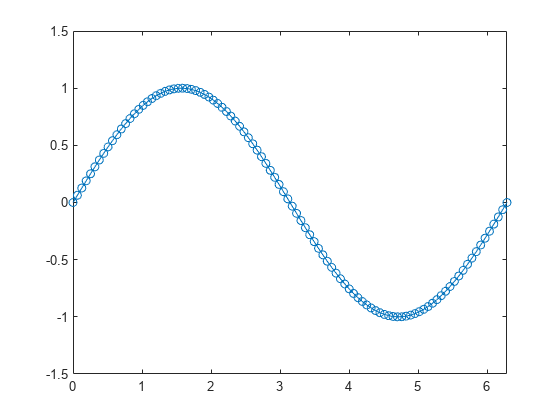
Change the axis limits so that the x-axis ranges from to and the y-axis ranges from -1.5 to 1.5.
axis([0 2*pi -1.5 1.5])
Add Padding Around Stairstep Plot
Create a stairstep plot, and use the axis padded command to add a margin of padding between the plot and the plot box.
x = 0:12;
y = sin(x);
stairs(x,y)
axis padded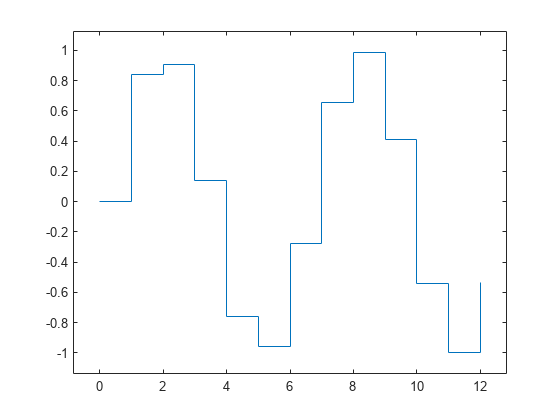
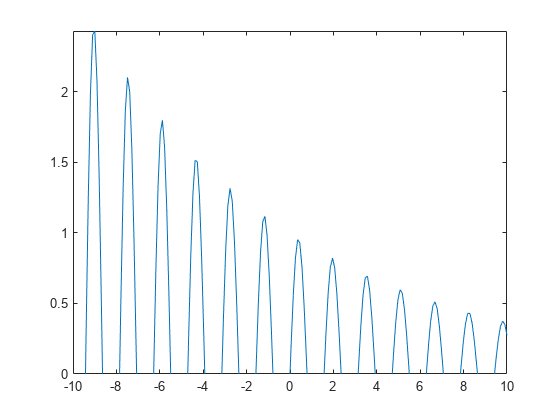
Use Semiautomatic Axis Limits
Create a plot. Set the limits for the x-axis and set the minimum y-axis limit. Use an automatically calculated value for the maximum y-axis limit.
x = linspace(-10,10,200);
y = sin(4*x)./exp(.1*x);
plot(x,y)
axis([-10 10 0 inf])
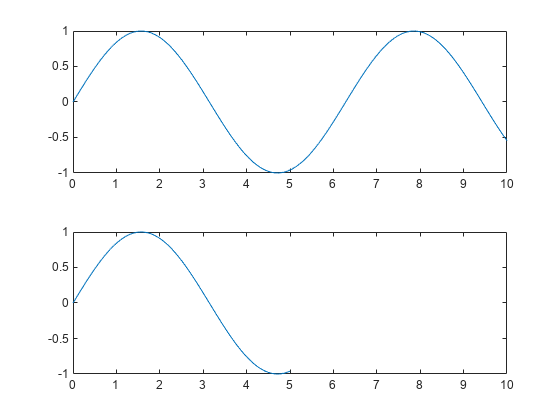
Set Axis Limits for Multiple Axes
Starting in R2019b, you can display a tiling of plots using the tiledlayout and nexttile functions. Call the tiledlayout function to create a 2-by-1 tiled chart layout. Call the nexttile function to create the axes objects ax1 and ax2. Plot data in each axes. Then set the axis limits for both axes to the same values.
tiledlayout(2,1)
x1 = linspace(0,10,100);
y1 = sin(x1);
ax1 = nexttile;
plot(ax1,x1,y1)

x2 = linspace(0,5,100);
y2 = sin(x2);
ax2 = nexttile;
plot(ax2,x2,y2)

axis([ax1 ax2],[0 10 -1 1])
Display Plot Without Axes Background
Plot a surface without displaying the axes lines and background.
surf(peaks)
axis off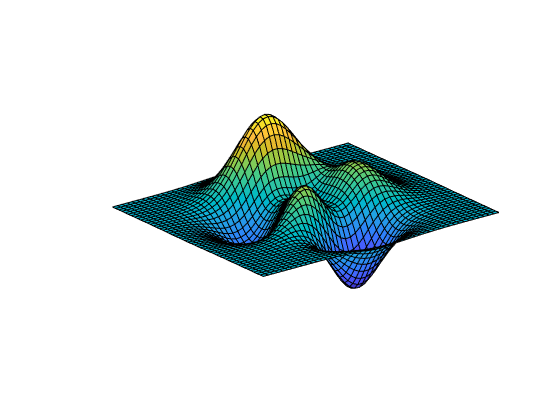
Use Tight Axis Limits and Return Values
Plot a surface. Set the axis limits to equal the range of the data so that the plot extends to the edges of the axes.
surf(peaks)
axis tight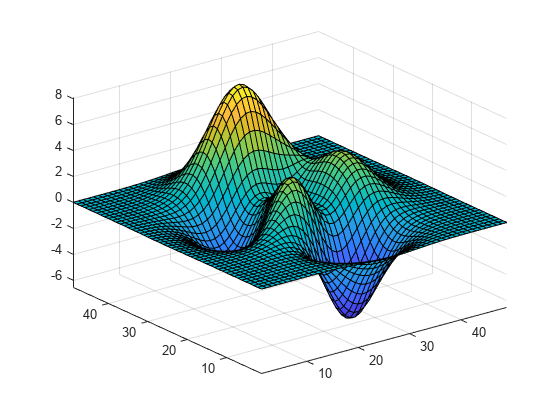
Return the values of the current axis limits.
l = axis
l = 1×6

    1.0000   49.0000    1.0000   49.0000   -6.5466    8.0752
Change Direction of Coordinate System
Create a checkerboard plot and change the direction of the coordinate system.
First, create the plot using the summer colormap. By default, the x values increase from left to right and the y values increase from bottom to top.
C = eye(10);
pcolor(C)
colormap summer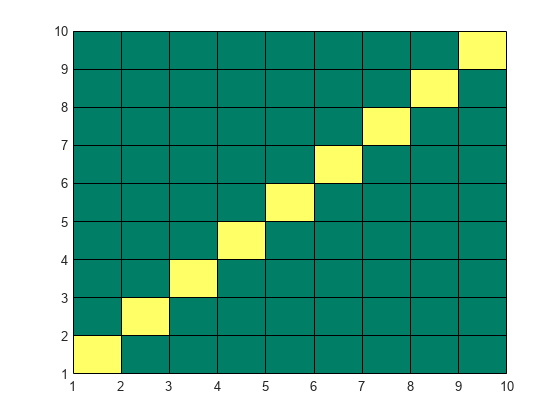
Reverse the coordinate system so that the y values increase from top to bottom.
axis ij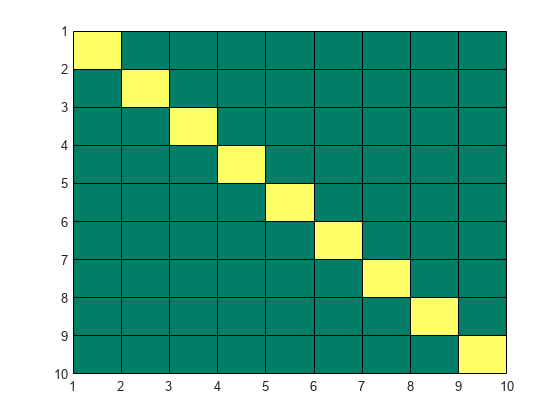
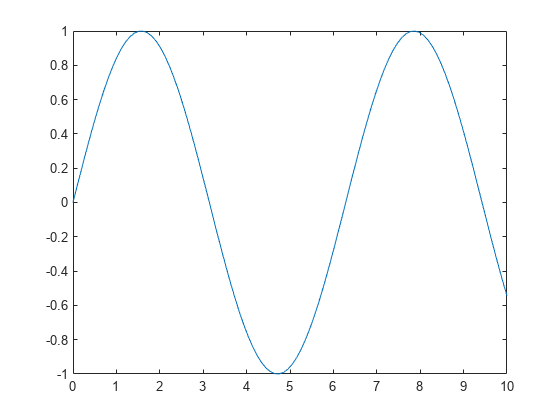
Retain Current Axis Limits When Adding New Plots
Plot a sine wave.
x = linspace(0,10);
y = sin(x);
plot(x,y)
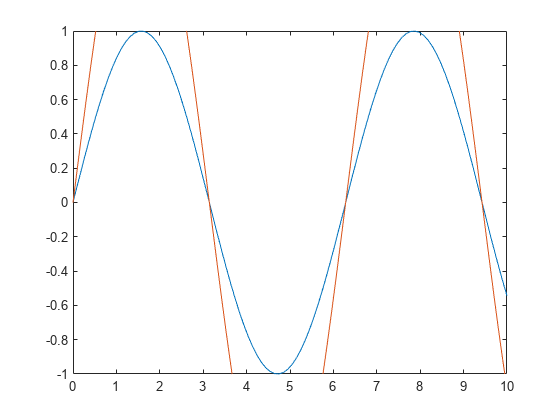
Add another sine wave to the axes using hold on. Keep the current axis limits by setting the limits mode to manual.
y2 = 2*sin(x);
hold on
axis manual
plot(x,y2)
hold off
If you want the axes to choose the appropriate limits, set the limits mode back to automatic.
axis auto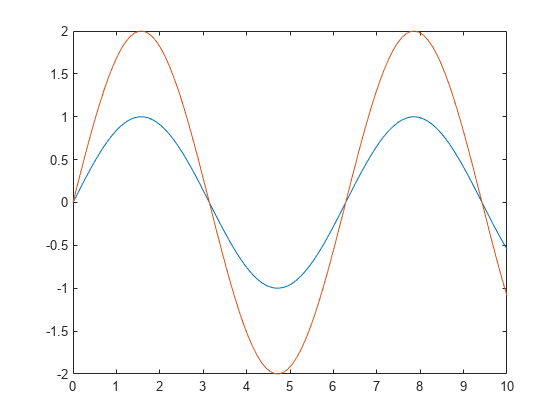
Input Arguments
Output Arguments
Tips
You can combine multiple input arguments together, for example,
axis image ij. The options are evaluated from left to right. Subsequent options can overwrite properties set by prior ones.If axes do not exist, the
axisfunction creates them.Use
hold onto keep plotting functions from overriding preset axis limits.
Version History
Introduced before R2006aSee Also
Functions
Properties
You can also select a web site from the following list:
Americas
- América Latina (Español)
- Canada (English)
- United States (English)
Europe
- Belgium (English)
- Denmark (English)
- Deutschland (Deutsch)
- España (Español)
- Finland (English)
- France (Français)
- Ireland (English)
- Italia (Italiano)
- Luxembourg (English)
- Netherlands (English)
- Norway (English)
- Österreich (Deutsch)
- Portugal (English)
- Sweden (English)
- Switzerland
- United Kingdom (English)