ezplot3
(Not recommended) Easy-to-use 3-D parametric curve plotter
ezplot3 is not recommended. Use fplot3 instead. For more information, see Compatibility Considerations.
Syntax
Description
ezplot3(___,'animate') produces an animated trace
of the spatial curve. Use this option after any of the input argument combinations
in the previous syntaxes.
ezplot3( plots into
the axes specified by ax,___)ax instead of the current axes. Specify
the axes before any of the input argument combinations in any of the previous
syntaxes.
h = ezplot3(___) returns the plotted objects. Use
h to modify properties of the plot after creating it.
Examples
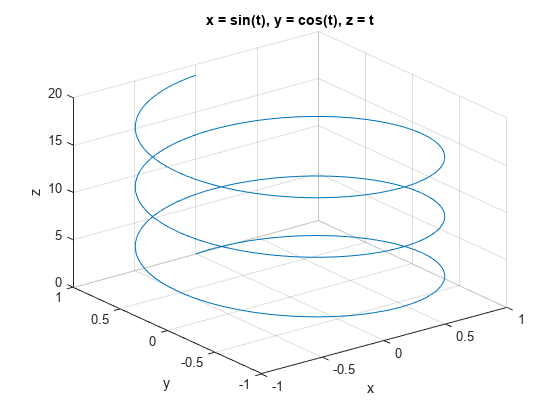
Plot a Parametric Curve
Plot this parametric curve over the domain .
ezplot3('sin(t)','cos(t)','t',[0,6*pi])
Input Arguments
Extended Capabilities
Version History
Introduced before R2006aYou can also select a web site from the following list:
Americas
- América Latina (Español)
- Canada (English)
- United States (English)
Europe
- Belgium (English)
- Denmark (English)
- Deutschland (Deutsch)
- España (Español)
- Finland (English)
- France (Français)
- Ireland (English)
- Italia (Italiano)
- Luxembourg (English)
- Netherlands (English)
- Norway (English)
- Österreich (Deutsch)
- Portugal (English)
- Sweden (English)
- Switzerland
- United Kingdom (English)