Main Content

ezsurfc

(Not recommended) Easy-to-use combination surface/contour plotter

    ezsurfc is not recommended. Use fsurf instead. For more information, see Compatibility Considerations.

    Description

    example

    ezsurfc(f) creates a surface plot of the function z = f(x,y) using the surfc function. The function plots f over the default interval [-2π 2π] for x and y.

    ezsurfc automatically adds a title and axis labels to the plot.

    ezsurfc(f,xyinterval) plots over the specified interval. To use the same interval for both x and y, specify xyinterval as a two-element vector of the form [min max]. To use different intervals, specify a four-element vector of the form [xmin xmax ymin ymax].

    ezsurfc(funx,funy,funz) plots the parametric surface funx(u,v), funy(u,v), and funz(u,v) over the default interval [-2π 2π] for u and v.

    ezsurfc(funx,funy,funz,uvinterval) plots the parametric surface using the specified interval.

    ezsurfc(___,n) plots using an n-by-n grid. Use this option after any of the input argument combinations in the previous syntaxes.

    ezsurfc(___,'circ') plots over a disk centered on the interval.

    ezsurfc(ax,___) plots into the axes specified by ax instead of the current axes. Specify the axes before any of the input argument combinations in any of the previous syntaxes.

    sc = ezsurfc(___) returns a graphics array that includes the chart surface object and the contour object. Use sc to modify the surface and contour plots after they are created. For a list of properties, see Surface Properties and Contour Properties.

    Examples

    collapse all

    Create a surface/contour plot of the expression f(x,y)=x2+y2 over the domain -5<x<5 and -2π<y<2π with a computational grid size of 35-by-35.

    ezsurfc('sqrt(x^2 + y^2)',[-5,5,-2*pi,2*pi],35)
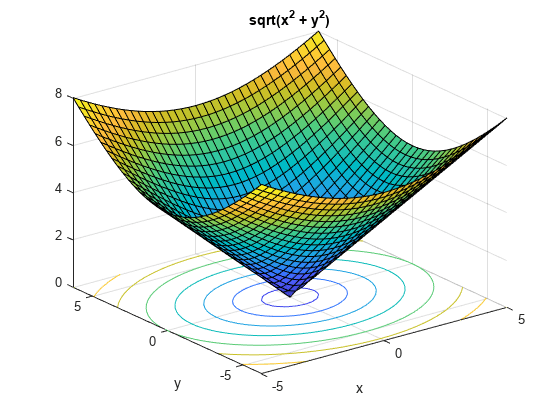
    Figure contains an axes object. The axes object with title sqrt ( x Squared baseline blank + blank y Squared baseline ), xlabel x, ylabel y contains 2 objects of type surface, contour.

    Input Arguments

    collapse all

    3-D function to plot, specified as a character vector, string scalar, or function handle to a named or anonymous function.

    Specify a function of the form z = f(x,y). The function must accept two matrix input arguments and return a matrix output argument of the same size.

    When specifying the function as a character vector or string scalar, array multiplication, division, and exponentiation are always implied. For example, x^2 is interpreted as x.^2.

    Example: 'sqrt(x^2 + y^2)'

    When specifying the function as a function handle, use array operators instead of matrix operators for the best performance. For example, use .* (times) instead of * (mtimes).

    Example: @(x,y) sin(x).*cos(y)

    Plotting interval for x and y, specified in one of these forms:

    • Vector of form [min max] — Use the interval [min max] for both x and y.

    • Vector of form [xmin xmax ymin ymax] — Use the interval [xmin xmax] for x and [ymin ymax] for y.

    Parametric function for x coordinates, specified as a character vector, string scalar, or function handle to a named or anonymous function.

    Specify a function of the form x = funx(u,v). The function must accept two matrix input arguments and return a matrix output argument of the same size.

    When specifying the function as a character vector or string scalar, array multiplication, division, and exponentiation are always implied. For example, x^2 is interpreted as x.^2.

    Example: 'u*sin(v)'

    When specifying the function as a function handle, use array operators instead of matrix operators for the best performance. For example, use .* (times) instead of * (mtimes).

    Example: @(u,v) u.*sin(v)

    Parametric function for y coordinates, specified as a character vector, string scalar, or function handle to a named or anonymous function.

    Specify a function of the form y = funy(u,v). The function must accept two matrix input arguments and return a matrix output argument of the same size.

    When specifying the function as a character vector or string scalar, array multiplication, division, and exponentiation are always implied. For example, x^2 is interpreted as x.^2.

    Example: '-u*cos(v)'

    When specifying the function as a function handle, use array operators instead of matrix operators for the best performance. For example, use .* (times) instead of * (mtimes).

    Example: @(u,v) -u.*cos(v)

    Parametric function for z coordinates, specified as a character vector, string scalar, or function handle to a named or anonymous function.

    Specify a function of the form z = funz(u,v). The function must accept two matrix input arguments and return a matrix output argument of the same size.

    When specifying the function as a character vector or string scalar, array multiplication, division, and exponentiation are always implied. For example, x^2 is interpreted as x.^2.

    Example: '-u*cos(v)'

    When specifying the function as a function handle, use array operators instead of matrix operators for the best performance. For example, use .* (times) instead of * (mtimes).

    Example: @(u,v) v

    Plotting interval for u and v, specified in one of these forms:

    • Vector of form [min max] — Use the interval [min max] for both u and v

    • Vector of form [umin umax vmin vmax] — Use the interval [umin umax] for u, and [vmin vmax] for v.

    Size of the grid, specified as a positive integer. The grid has dimensions n-by-n.

    Axes object. If you do not specify an axes object, then ezsurfc uses the current axes.

    Extended Capabilities

    Version History

    Introduced before R2006a

    collapse all

    R2016a: ezsurfc is not recommended

    ezsurfc is not recommended. Use fsurf instead. There are no plans to remove ezsurfc.

    fsurf requires that the input function to plot is a function handle. ezsurfc accepts either a function handle, a character vector, or a string. This table shows some typical usages of ezsurfc and how to update your code to use fsurf instead.

    Not RecommendedRecommended
    ezsurfc('sin(x)+cos(y)')fsurf(@(x,y) sin(x)+cos(y),'ShowContours','on')
    ezsurfc(@(x,y) sqrt(x.^2+y.^2))fsurf(@(x,y) sqrt(x.^2+y.^2),'ShowContours','on')