griddatan
Interpolate N-D scattered data
Description
Examples
Fit Hypersurface
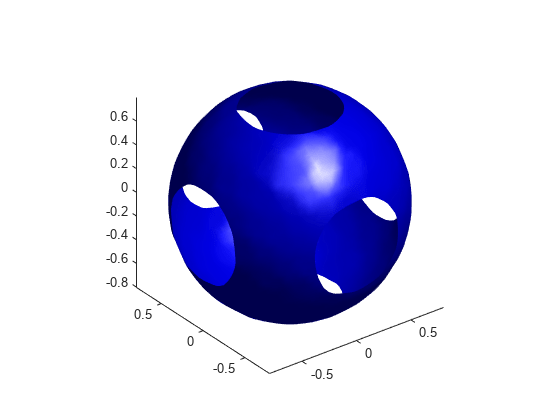
Interpolate a 4-D scattered data set and visualize a 3-D isosurface of the interpolated data.
Create a scattered set of sample points.
rng default
X = 2*rand([5000 3])-1;
Y = sum(X.^2,2);
Create x, y, and z grids to use as the 3-D set of query points, and interpolate the scattered data at these points.
d = -0.8:0.05:0.8;
[y0,x0,z0] = ndgrid(d,d,d);
XI = [x0(:) y0(:) z0(:)];
YI = griddatan(X,Y,XI);
Since it is difficult to visualize 4-D data sets, use isosurface at 0.8 to visualize the interpolation result.
YI = reshape(YI, size(x0));
p = patch(isosurface(x0,y0,z0,YI,0.8));
isonormals(x0,y0,z0,YI,p)
p.FaceColor = "blue";
p.EdgeColor = "none";
view(3)
axis equal
camlight
lighting phong
Nearest Neighbor Interpolation
Use nearest neighbor interpolation on a 3-D scattered data set.
Create a sample 3-D data set. The matrix X contains the xyz locations of the observed data, and v contains the (randomly generated) observed data. This type of data set could represent, for example, oxygen levels in ocean water at these locations.
rng default
X = [rand(100,1) rand(100,1) rand(100,1)];
v = rand(100,1);
Use nearest neighbor interpolation to approximate the value of the underlying function at some query points.
[xx,yy,zz] = meshgrid(0:0.05:1);
xq = [xx(:) yy(:) zz(:)];
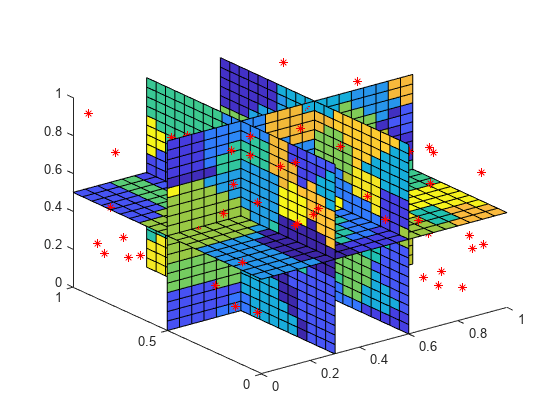
vq = griddatan(X,v,xq,"nearest");Plot slices of the result on top of the sample point locations.
vq = reshape(vq,size(xx));
plot3(X(:,1),X(:,2),X(:,3),"r*")
hold on
slice(xx,yy,zz,vq,[0.3 0.6],0.5,0.5)
hold off
Input Arguments
Output Arguments
Tips
It is not practical to use
griddatanfor interpolation in dimensions higher than about 6-D, because the memory required by the underlying triangulation grows exponentially with the number of dimensions.Scattered data interpolation with
griddatanuses a Delaunay triangulation of the data, so can be sensitive to scaling issues inx. When this occurs, you can usenormalizeto rescale the data and improve the results. See Normalize Data with Differing Magnitudes for more information.
Extended Capabilities
Version History
Introduced before R2006a
You can also select a web site from the following list:
Americas
- América Latina (Español)
- Canada (English)
- United States (English)
Europe
- Belgium (English)
- Denmark (English)
- Deutschland (Deutsch)
- España (Español)
- Finland (English)
- France (Français)
- Ireland (English)
- Italia (Italiano)
- Luxembourg (English)
- Netherlands (English)
- Norway (English)
- Österreich (Deutsch)
- Portugal (English)
- Sweden (English)
- Switzerland
- United Kingdom (English)