gtext
Add text to figure using mouse
Description
gtext( inserts
the text, str)str, at the location you select with
the mouse. When you hover over the figure window, the pointer becomes
a crosshair. gtext is waiting for you to select
a location. Move the pointer to the location you want and either click
the figure or press any key, except Enter.
gtext( specifies
text properties using one or more name-value pair arguments. For example, str,Name,Value)'FontSize',14 specifies
a 14-point font.
t = gtext(___)gtext. Use t to
modify properties of the text objects after they are created. For
a list of properties and descriptions, see Text Properties. You can return an output argument
using any of the arguments from the previous syntaxes.
Examples
Add Text to Figure Using Mouse
Create a simple line plot and use gtext to
add text to the figure using the mouse.
plot(1:10)
gtext('My Plot')
Click the figure to place the text at the selected location.

Specify Font Size and Color
Create a simple line plot and add text to the figure using the mouse. Use a red, 14-point font.
plot(1:10)
gtext('My Plot','Color','red','FontSize',14)
Click the figure where you want to display the text.

Modify Text After Creation
Create a simple line plot and add text to the
figure using the mouse. Return the text object created, t.
plot(1:10)
t = gtext('My Plot')
Click the figure to place the text and create the text object.

t =

  Text (My Plot) with properties:

                 String: 'My Plot'
               FontSize: 10
             FontWeight: 'normal'
               FontName: 'Helvetica'
                  Color: [0 0 0]
    HorizontalAlignment: 'left'
               Position: [4.3906 5.3950 0]
                  Units: 'data'

  Show all properties
Use t to change the font size and color of the text by setting text
properties. Use dot notation to set properties.
t.Color = 'red';
t.FontSize = 14;
Input Arguments
str — Text to display
character vector | cell array of character vectors | character array | string array
Text to display, specified in one of these forms:
Character vector — Display the text with one click, for example:
gtext('my text')Cell array of character vectors — Display one row of the array with each click. For example, this code displays
firstwith the first click andsecondwith the second click.gtext({'first';'second'})To display multiline text, specify more than one character vector per row.
gtext({'first','new line';'second','new line'})Character array — Display one row of the array with each click. Each row must contain the same number of characters, for example:
gtext(['one';'two'])
String array — Display one row of the array with each click. For example:
gtext(["one";"two"])
To include special characters, such as superscripts, subscripts,
Greek letters, or mathematical symbols, use TeX markup. For a list
of supported markup, see the Interpreter property.
Name-Value Arguments
Specify optional pairs of arguments as
Name1=Value1,...,NameN=ValueN, where Name is
the argument name and Value is the corresponding value.
Name-value arguments must appear after other arguments, but the order of the
pairs does not matter.
Before R2021a, use commas to separate each name and value, and enclose
Name in quotes.
Example: text(.5,.5,'my text','FontSize',14,'Color','red')
The properties listed here are only a subset. For a full list, see Text Properties.
Note
You cannot specify the Position text property
as a name-value pair during text creation. gtext ignores
the specified value.
Text color, specified as an RGB triplet, a hexadecimal color code, a color name, or a short
name. The default value of [0 0 0] corresponds to black.
For a custom color, specify an RGB triplet or a hexadecimal color code.
An RGB triplet is a three-element row vector whose elements specify the intensities of the red, green, and blue components of the color. The intensities must be in the range
[0,1], for example,[0.4 0.6 0.7].A hexadecimal color code is a string scalar or character vector that starts with a hash symbol (
#) followed by three or six hexadecimal digits, which can range from0toF. The values are not case sensitive. Therefore, the color codes"#FF8800","#ff8800","#F80", and"#f80"are equivalent.
Alternatively, you can specify some common colors by name. This table lists the named color options, the equivalent RGB triplets, and hexadecimal color codes.
| Color Name | Short Name | RGB Triplet | Hexadecimal Color Code | Appearance |
|---|---|---|---|---|
"red" | "r" | [1 0 0] | "#FF0000" |
|
"green" | "g" | [0 1 0] | "#00FF00" |
|
"blue" | "b" | [0 0 1] | "#0000FF" |
|
"cyan"
| "c" | [0 1 1] | "#00FFFF" |
|
"magenta" | "m" | [1 0 1] | "#FF00FF" |
|
"yellow" | "y" | [1 1 0] | "#FFFF00" |
|
"black" | "k" | [0 0 0] | "#000000" |
|
"white" | "w" | [1 1 1] | "#FFFFFF" |
|
"none" | Not applicable | Not applicable | Not applicable | No color |
Here are the RGB triplets and hexadecimal color codes for the default colors MATLAB uses in many types of plots.
| RGB Triplet | Hexadecimal Color Code | Appearance |
|---|---|---|
[0 0.4470 0.7410] | "#0072BD" |
|
[0.8500 0.3250 0.0980] | "#D95319" |
|
[0.9290 0.6940 0.1250] | "#EDB120" |
|
[0.4940 0.1840 0.5560] | "#7E2F8E" |
|
[0.4660 0.6740 0.1880] | "#77AC30" |
|
[0.3010 0.7450 0.9330] | "#4DBEEE" |
|
[0.6350 0.0780 0.1840] | "#A2142F" |
|
Example: 'blue'
Example: [0
0 1]
Example: '#0000FF'
Horizontal alignment of the text with respect to the x value
in the Position property, specified as one of the
values in this table. The vertical line indicates where the x value
lies in relation to the text.
| Value | Result |
|---|---|
'left' (default) |
|
'center' |
|
'right' |
|
Text interpreter, specified as one of these values:
'tex'— Interpret characters using a subset of TeX markup.'latex'— Interpret characters using LaTeX markup.'none'— Display literal characters.
TeX Markup
By default, MATLAB supports a subset of TeX markup. Use TeX markup to add superscripts and subscripts, modify the font type and color, and include special characters in the text.
Modifiers remain in effect until the end of the text.
Superscripts and subscripts are an exception because they modify only the next character or the
characters within the curly braces. When you set the interpreter to 'tex',
the supported modifiers are as follows.
| Modifier | Description | Example |
|---|---|---|
^{ } | Superscript | 'text^{superscript}' |
_{ } | Subscript | 'text_{subscript}' |
\bf | Bold font | '\bf text' |
\it | Italic font | '\it text' |
\sl | Oblique font (usually the same as italic font) | '\sl text' |
\rm | Normal font | '\rm text' |
\fontname{ | Font name — Replace
| '\fontname{Courier} text' |
\fontsize{ | Font size —Replace
| '\fontsize{15} text' |
\color{ | Font color — Replace
red, green,
yellow, magenta,
blue, black,
white, gray,
darkGreen, orange, or
lightBlue. | '\color{magenta} text' |
\color[rgb]{specifier} | Custom font color — Replace
| '\color[rgb]{0,0.5,0.5} text' |
This table lists the supported special characters for the
'tex' interpreter.
| Character Sequence | Symbol | Character Sequence | Symbol | Character Sequence | Symbol |
|---|---|---|---|---|---|
| α |
| υ |
| ~ |
| ∠ |
| ϕ |
| ≤ |
|
|
| χ |
| ∞ |
| β |
| ψ |
| ♣ |
| γ |
| ω |
| ♦ |
| δ |
| Γ |
| ♥ |
| ϵ |
| Δ |
| ♠ |
| ζ |
| Θ |
| ↔ |
| η |
| Λ |
| ← |
| θ |
| Ξ |
| ⇐ |
| ϑ |
| Π |
| ↑ |
| ι |
| Σ |
| → |
| κ |
| ϒ |
| ⇒ |
| λ |
| Φ |
| ↓ |
| µ |
| Ψ |
| º |
| ν |
| Ω |
| ± |
| ξ |
| ∀ |
| ≥ |
| π |
| ∃ |
| ∝ |
| ρ |
| ∍ |
| ∂ |
| σ |
| ≅ |
| • |
| ς |
| ≈ |
| ÷ |
| τ |
| ℜ |
| ≠ |
| ≡ |
| ⊕ |
| ℵ |
| ℑ |
| ∪ |
| ℘ |
| ⊗ |
| ⊆ |
| ∅ |
| ∩ |
| ∈ |
| ⊇ |
| ⊃ |
| ⌈ |
| ⊂ |
| ∫ |
| · |
| ο |
| ⌋ |
| ¬ |
| ∇ |
| ⌊ |
| x |
| ... |
| ⊥ |
| √ |
| ´ |
| ∧ |
| ϖ |
| ∅ |
| ⌉ |
| 〉 |
| | |
| ∨ |
| 〈 |
| © |
LaTeX Markup
To use LaTeX markup, set the interpreter to 'latex'. For inline
mode, surround the markup with single dollar signs ($). For
display mode, surround the markup with double dollar signs
($$).
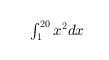
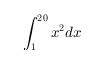
| LaTeX Mode | Example | Result |
|---|---|---|
| Inline |
'$\int_1^{20} x^2 dx$' |
|
| Display |
'$$\int_1^{20} x^2 dx$$' |
|
The displayed text uses the default LaTeX font style. The
FontName, FontWeight, and
FontAngle properties do not have an effect. To change the
font style, use LaTeX markup.
The maximum size of the text that you can use with the LaTeX interpreter is 1200 characters. For multiline text, this reduces by about 10 characters per line.
For examples that use TeX and LaTeX, see Greek Letters and Special Characters in Chart Text. For more information about the LaTeX system, see The LaTeX Project website at https://www.latex-project.org/.
Algorithms
gtext uses the ginput and text functions.
Version History
Introduced before R2006a
You can also select a web site from the following list:
Americas
- América Latina (Español)
- Canada (English)
- United States (English)
Europe
- Belgium (English)
- Denmark (English)
- Deutschland (Deutsch)
- España (Español)
- Finland (English)
- France (Français)
- Ireland (English)
- Italia (Italiano)
- Luxembourg (English)
- Netherlands (English)
- Norway (English)
- Österreich (Deutsch)
- Portugal (English)
- Sweden (English)
- Switzerland
- United Kingdom (English)