image
Display image from array
Syntax
Description
image( displays the data in array
C)C as an image. Each element of C
specifies the color for 1 pixel of the image. The resulting image is an
m-by-n grid of pixels where
m is the number of rows and n is the
number of columns in C. The row and column indices of the
elements determine the centers of the corresponding pixels.
image( specifies
the image location. Use x,y,C)x and y to
specify the locations of the corners corresponding to C(1,1) and C(m,n).
To specify both corners, set x and y as
two-element vectors. To specify the first corner and let image determine
the other, set x and y as scalar
values. The image is stretched and oriented as applicable.
image('CData', adds
the image to the current axes without replacing existing plots. This
syntax is the low-level version of C)image(C). For
more information, see High-Level Versus Low-Level Version of Image.
image(___, specifies
image properties using one or more name-value pair arguments. You
can specify image properties with any of the input argument combinations
in the previous syntaxes.Name,Value)
image( creates
the image in the axes specified by ax,___)ax instead of
in the current axes (gca). The option ax can
precede any of the input argument combinations in the previous syntaxes.
im = image(___)Image object created. Use im to
set properties of the image after it is created. You can specify this
output with any of the input argument combinations in the previous
syntaxes. For a list of image properties and descriptions, see Image Properties.
Examples
Display Image of Matrix Data
Create matrix C. Display an image of the data in C. Add a colorbar to the graph to show the current colormap.
C = [0 2 4 6; 8 10 12 14; 16 18 20 22];
image(C)
colorbar
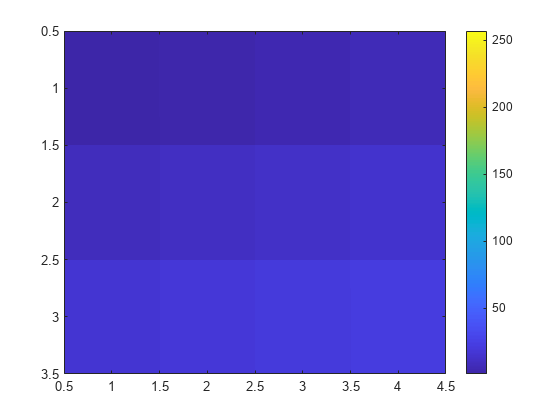
By default, the CDataMapping property for the image is set to 'direct' so image interprets values in C as indices into the colormap. For example, the bottom right pixel corresponding to the last element in C, 22, uses the 22nd color of the colormap.
Scale the values to the full range of the current colormap by setting the CDataMapping property to 'scaled' when creating the image.
image(C,'CDataMapping','scaled')
colorbar
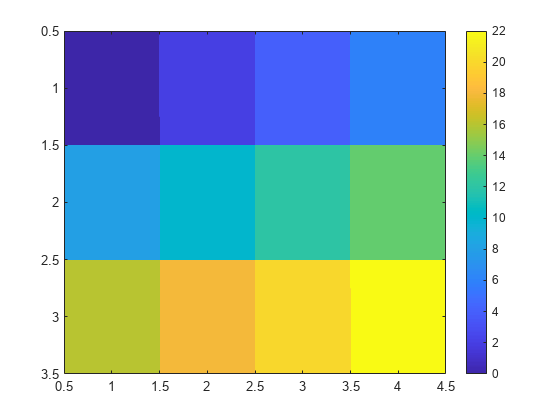
Alternatively, you can use the imagesc function to scale the values instead of using image(C,'CDataMapping','scaled'). For example, use imagesc(C).
Control Image Placement
Place the image so that it lies between 5 and 8 on the x-axis and between 3 and 6 on the y-axis.
x = [5 8];
y = [3 6];
C = [0 2 4 6; 8 10 12 14; 16 18 20 22];
image(x,y,C)
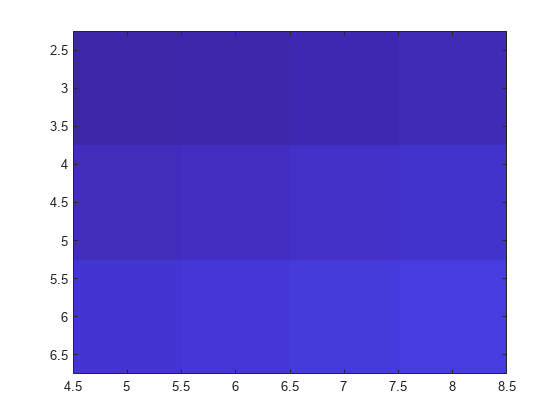
Notice that the pixel corresponding to C(1,1) is centered over the point (5,3). The pixel corresponding to C(3,4) is centered over the point (8,6). image positions and orients the rest of the image between those two points.
Display Image of 3-D Array of True Colors
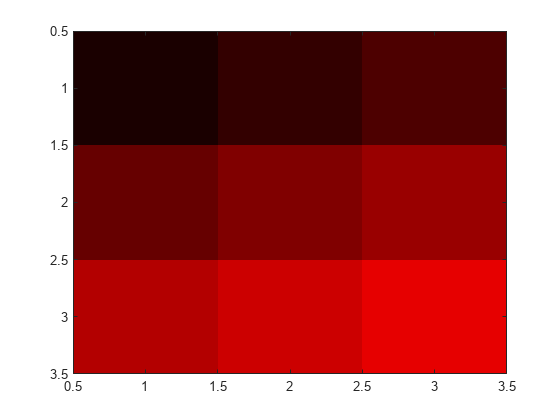
Create C as a 3-D array of true colors. Use only red colors by setting the last two pages of the array to zeros.
C = zeros(3,3,3);
C(:,:,1) = [.1 .2 .3; .4 .5 .6; .7 .8 .9]
C =
C(:,:,1) =

    0.1000    0.2000    0.3000
    0.4000    0.5000    0.6000
    0.7000    0.8000    0.9000


C(:,:,2) =

     0     0     0
     0     0     0
     0     0     0


C(:,:,3) =

     0     0     0
     0     0     0
     0     0     0
Display an image of the data in C.
image(C)
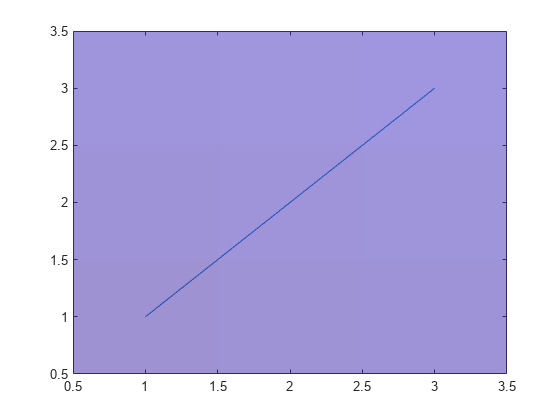
Modify Image After Creation
Plot a line, and then create an image on top of the line. Return the image object.
plot(1:3)
hold on
C = [1 2 3; 4 5 6; 7 8 9];
im = image(C);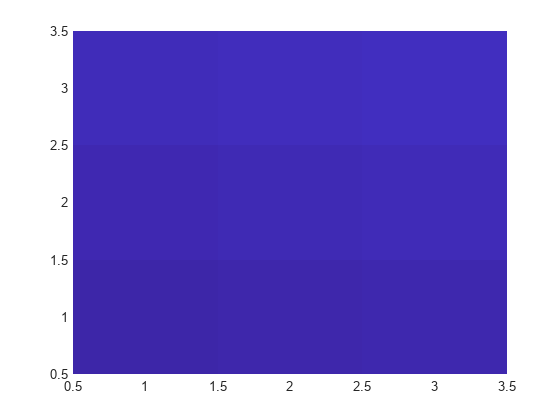
Make the image semitransparent so that the line shows through the image.
im.AlphaData = 0.5;
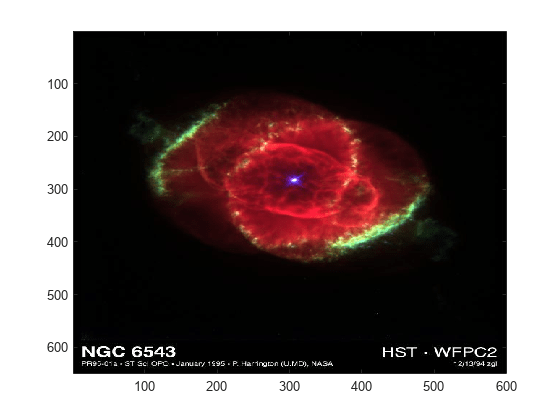
Read and Display JPEG Image File
Read a JPEG image file.
C = imread('ngc6543a.jpg');imread returns a 650-by-600-by-3 array, C.
Display the image.
image(C)
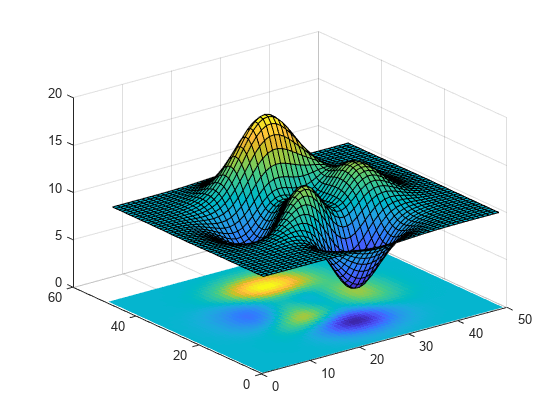
Add Image to Axes in 3-D View
Create a surface plot. Then, add an image under the surface. image displays the image in the xy-plane.
Z = 10 + peaks;
surf(Z)
hold on
image(Z,'CDataMapping','scaled')
Input Arguments
C — Image color data
vector or matrix | 3-D array of RGB triplets
Image color data, specified in one of these forms:
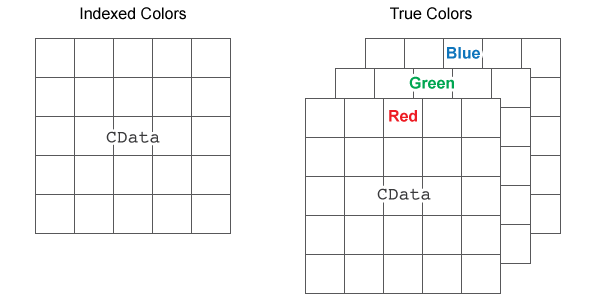
Vector or matrix — This format defines indexed image data. Each element of
Cdefines a color for 1 pixel of the image. For example,C = [1 2 3; 4 5 6; 7 8 9];. The elements ofCmap to colors in the colormap of the associated axes. TheCDataMappingproperty controls the mapping method.3-D array of RGB triplets — This format defines true color image data using RGB triplet values. Each RGB triplet defines a color for 1 pixel of the image. An RGB triplet is a three-element vector that specifies the intensities of the red, green, and blue components of the color. The first page of the 3-D array contains the red components, the second page contains the green components, and the third page contains the blue components. Since the image uses true colors instead of colormap colors, the
CDataMappingproperty has no effect.If
Cis of typedouble, then an RGB triplet value of[0 0 0]corresponds to black and[1 1 1]corresponds to white.If
Cis an integer type, then the image uses the full range of data to determine the color. For example, ifCis of typeuint8, then[0 0 0]corresponds to black and[255 255 255]corresponds to white. IfCDatais of typeint8, then[-128 -128 -128]corresponds to black and[127 127 127]corresponds to white.If
Cis of typelogical, then[0 0 0]corresponds to black and[1 1 1]corresponds to white.
This illustration shows the relative dimensions of C for
the two color models.
The behavior of NaN elements is not defined.
To use the low-level version of the image function instead, set the
CData property
as a name-value pair. For example,
image('CData',C).
Converting Between double and Integer Data Types
When you call the image function with a vector or 2-D matrix and use the
default CDataMapping value, you must offset your
data values by 1 when converting between double
values and integer types. This offset is not necessary when
CDataMapping is set to
'scaled'.
For example, if U8 contains indexed image data of
type uint8, you can convert it to type
double
using:
D = double(U8) + 1;
To convert indexed image data from type double to an integer type, subtract
1 and use round to ensure that all the values are
integers. For example, if D contains indexed image
data of type double, convert it to
uint8
using:
U8 = uint8(round(D - 1));
Converting Between Normalized double and Truecolor Values
To convert true color image data from an integer type to type
double, rescale the data. For example, if
RGB8 is true color image data of type
uint8, convert it to double
using:
RGB = double(RGB8)/255;
To convert true color image data from type double
to an integer type, rescale the data and use round to
ensure that all the values are integers. For example, if
RGB is image data of type
double, convert it to uint8
using:
RGB8 = uint8(round(RGB*255));
Data Types: single | double | int8 | int16 | int32 | int64 | uint8 | uint16 | uint32 | uint64 | logical
x — Placement along x-axis
[1 size(C,2)] (default) | two-element vector | scalar
Placement along the x-axis, specified in one of these forms:
Two-element vector — Use the first element as the location for the center of
C(1,1)and the second element as the location for the center ofC(m,n), where[m,n] = size(C). IfCis a 3-D array, thenmandnare the first two dimensions. Evenly distribute the centers of the remaining elements ofCbetween those two points.The width of each pixel is determined by the expression:
(x(2)-x(1))/(size(C,2)-1)
If
x(1)>x(2), then the image is flipped left-right.Scalar — Center
C(1,1)at this location and each following element one unit apart.
Note
If
xhas more than two elements,imageuses the first and last elements and ignores the other elements.To use the low-level version of the
imagefunction instead, set theXDataproperty by using a name-value argument. For example,image('XData',x,'YData',y,'CData',C).You cannot interactively pan or zoom outside the x-axis limits or y-axis limits of an image, unless the limits are already set outside the bounds of the image. If the limits are already outside the bounds, there is no such restriction. If other objects (such as a line) occupy the axes and extend beyond the bounds of the image, you can pan or zoom to the bounds of the other objects, but no further.
Data Types: single | double | int8 | int16 | int32 | int64 | uint8 | uint16 | uint32 | uint64 | logical | datetime (since R2023b) | duration (since R2023b) | categorical (since R2023b)
y — Placement along y-axis
[1 size(C,1)] (default) | two-element vector | scalar
Placement along y-axis, specified in one of these forms:
Two-element vector — Use the first element as the location for the center of
C(1,1)and the second element as the location for the center ofC(m,n), where[m,n] = size(C). IfCis a 3-D array, thenmandnare the first two dimensions. Evenly distribute the centers of the remaining elements ofCbetween those two points.The height of each pixel is determined by the expression:
(y(2)-y(1))/(size(C,1)-1)
If
y(1)>y(2), then the image is flipped up-down.Scalar — Center
C(1,1)at this location and each following element one unit apart.
Note
If
yhas more than two elements,imageuses the first and last elements and ignores the other elements.To use the low-level version of the
imagefunction instead, set theYDataproperty by using a name-value argument. For example,image('XData',x,'YData',y,'CData',C).You cannot interactively pan or zoom outside the x-axis limits or y-axis limits of an image, unless the limits are already set outside the bounds of the image. If the limits are already outside the bounds, there is no such restriction. If other objects (such as a line) occupy the axes and extend beyond the bounds of the image, you can pan or zoom to the bounds of the other objects, but no further.
Data Types: single | double | int8 | int16 | int32 | int64 | uint8 | uint16 | uint32 | uint64 | logical | datetime (since R2023b) | duration (since R2023b) | categorical (since R2023b)
ax — Axes object
Axes object
Axes object. If you do not specify an Axes object,
then image uses the current axes.
Name-Value Arguments
Specify optional pairs of arguments as
Name1=Value1,...,NameN=ValueN, where Name is
the argument name and Value is the corresponding value.
Name-value arguments must appear after other arguments, but the order of the
pairs does not matter.
Before R2021a, use commas to separate each name and value, and enclose
Name in quotes.
Example: image([1 2 3],'AlphaData',0.5) displays
a semitransparent image.
The properties listed here are a subset of image properties. For a complete list, see Image Properties.
Output Arguments
More About
Tips
Extended Capabilities
Version History
Introduced before R2006aYou can also select a web site from the following list:
Americas
- América Latina (Español)
- Canada (English)
- United States (English)
Europe
- Belgium (English)
- Denmark (English)
- Deutschland (Deutsch)
- España (Español)
- Finland (English)
- France (Français)
- Ireland (English)
- Italia (Italiano)
- Luxembourg (English)
- Netherlands (English)
- Norway (English)
- Österreich (Deutsch)
- Portugal (English)
- Sweden (English)
- Switzerland
- United Kingdom (English)