surfc
Contour plot under surface plot
Description
surfc(
creates a three-dimensional surface plot with a contour plot underneath. A
surface plot is a three-dimensional surface that has solid edge colors and solid
face colors. The function plots the values in matrix X,Y,Z)Z as
heights above a grid in the x-y plane
defined by X and Y. The color of the
surface varies according to the heights specified by
Z.
surfc( creates a surface and
contour plot and uses the column and row indices of the elements in
Z)Z as the x- and y
-coordinates.
surfc( plots into
the axes specified by ax,___)ax instead of the current axes. Specify
the axes as the first input argument.
surfc(___,
specifies surface properties using one or more name-value pair arguments. For
example, Name,Value)'FaceAlpha',0.5 creates a semitransparent
surface.
sc = surfc(___) returns a graphics array that
includes the chart surface object and the contour object. Use
sc to modify the surface and contour plots after they are
created. For a list of properties, see Surface Properties and Contour Properties.
Examples
Display Contour Plot Under Surface Plot
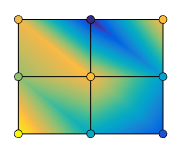
Create three matrices of the same size. Then plot them as a surface and display a contour plot under the surface plot. The surface uses Z for both height and color.
[X,Y] = meshgrid(1:0.5:10,1:20);
Z = sin(X) + cos(Y);
surfc(X,Y,Z)

Specify Colormap Colors for Surface and Contour Plot
Specify the colors for a surface and a contour plot by including a fourth matrix input, C. The surface plot uses Z for height and C for color. Specify the colors using a colormap, which uses single numbers to stand for colors on a spectrum. When you use a colormap, C is the same size as Z. Add a color bar to the graph to show how the data values in C correspond to the colors in the colormap.
[X,Y] = meshgrid(-3:.125:3);
Z = peaks(X,Y);
C = X.*Y;
surfc(X,Y,Z,C)
colorbar

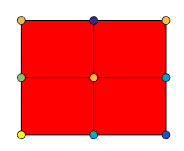
Modify Appearance of Surface and Contour Plots
Create a blue surface plot with a contour plot underneath it by specifying the FaceColor name-value pair with 'b' as the value. To allow further modifications, assign the graphics array containing the surface and contour objects to the variable sc.
[X,Y] = meshgrid(-5:.5:5);
Z = Y.*sin(X) - X.*cos(Y);
sc = surfc(X,Y,Z,'FaceColor','b');

Index into sc to access and modify properties of the surface and contour plots after they are created. The surface plot is accessible as sc(1) and the contour plot as sc(2). For example, change the edge colors of the two plots by setting the EdgeColor properties.
sc(1).EdgeColor = 'r';
sc(2).EdgeColor = 'b';

Change Location of Contour Lines
The contour lines appear at the minimum z-level by default, but you can change the location by setting the ZLocation property.
Display the peaks data set as a surface plot with the contours at the minimum z-level. Specify a return argument when you call the surfc function so that you can access the Contour object.
Z = peaks;
sc = surfc(Z);

Get the current axes and extend the upper limit of the z-axis to 15. Then move the contours to the maximum z-level.
ax = gca;
ax.ZLim(2) = 15;
sc(2).ZLocation = 'zmax';
Input Arguments
X — x-coordinates
matrix | vector
x-coordinates, specified as a matrix the same size as
Z, or as a vector with length n,
where [m,n] = size(Z). If you do not specify values for
X and Y,
surfc uses the vectors (1:n) and
(1:m).
When X is a matrix, the values must be strictly
increasing or decreasing along one dimension and remain constant along the
other dimension. The dimension that varies must be the opposite of the
dimension that varies in Y. You can use the meshgrid function to create
X and Y matrices.
When X is a vector, the values must be strictly
increasing or decreasing.
The XData properties of the surface and contour
objects store the x-coordinates.
Example: X = 1:10
Example: X = [1 2 3; 1 2 3; 1 2 3]
Example: [X,Y] = meshgrid(-5:0.5:5)
Data Types: single | double | int8 | int16 | int32 | int64 | uint8 | uint16 | uint32 | uint64 | categorical
Y — y-coordinates
matrix | vector
y-coordinates, specified as a matrix the same size as
Z or as a vector with length m,
where [m,n] = size(Z). If you do not specify values for
X and Y,
surfc uses the vectors (1:n) and
(1:m).
When Y is a matrix, the values must be strictly
increasing or decreasing along one dimension and remain constant along the
other dimension. The dimension that varies must be the opposite of the
dimension that varies in X. You can use the meshgrid function to create
X and Y matrices.
When Y is a vector, the values must be strictly
increasing or decreasing.
The YData properties of the surface and contour
objects store the y-coordinates.
Example: Y = 1:10
Example: Y = [1 1 1; 2 2 2; 3 3 3]
Example: [X,Y] = meshgrid(-5:0.5:5)
Data Types: single | double | int8 | int16 | int32 | int64 | uint8 | uint16 | uint32 | uint64 | categorical
Z — z-coordinates
matrix
z-coordinates, specified as a matrix.
Z must have at least two rows and two columns.
Z specifies the height of the surface plot at each
x-y coordinate. If you do not
specify the colors, then Z also specifies the surface
colors.
The ZData properties of the surface and contour
objects store the z-coordinates.
Example: Z = [1 2 3; 4 5 6]
Example: Z = sin(x) + cos(y)
Data Types: single | double | int8 | int16 | int32 | int64 | uint8 | uint16 | uint32 | uint64 | categorical
C — Color array
matrix | m-by-n-by-3
array of RGB triplets
Color array, specified as an m-by-n
matrix of colormap indices or as an
m-by-n-by-3
array of RGB triplets, where Z is
m-by-n.
To use colormap colors, specify
Cas a matrix. For each grid point on the surface,Cindicates a color in the colormap. TheCDataMappingproperty of the surface object controls how the values inCcorrespond to colors in the colormap.To use truecolor colors, specify
Cas an array of RGB triplets.
For more information, see Differences Between Colormaps and Truecolor.
The CData property of the surface object stores the
color array. For additional control over the surface coloring, use the
FaceColor and EdgeColor
properties.
ax — Axes to plot in
axes object
Axes to plot in, specified as an axes object. If you do
not specify the axes, then surfc plots into the current
axes.
Name-Value Arguments
Specify optional pairs of arguments as
Name1=Value1,...,NameN=ValueN, where Name is
the argument name and Value is the corresponding value.
Name-value arguments must appear after other arguments, but the order of the
pairs does not matter.
Before R2021a, use commas to separate each name and value, and enclose
Name in quotes.
Example: surfc(X,Y,Z,'FaceAlpha',0.5,'EdgeColor','none') creates
a semitransparent surface with no edges drawn.
Note
The properties listed here are only a subset. For a full list, see Surface Properties.
Edge line color, specified as one of the values listed here.
The default color of [0 0 0] corresponds to black
edges.
| Value | Description |
|---|---|
'none' | Do not draw the edges. |
'flat' | Use a different color for each edge based on the values
in the
|
'interp' |
Use interpolated coloring for each edge based on the values in the
|
| RGB triplet, hexadecimal color code, or color name |
Use the specified color for all the edges. This option does not use the color
values in the
|
RGB triplets and hexadecimal color codes are useful for specifying custom colors.
An RGB triplet is a three-element row vector whose elements specify the intensities of the red, green, and blue components of the color. The intensities must be in the range
[0,1]; for example,[0.4 0.6 0.7].A hexadecimal color code is a character vector or a string scalar that starts with a hash symbol (
#) followed by three or six hexadecimal digits, which can range from0toF. The values are not case sensitive. Thus, the color codes"#FF8800","#ff8800","#F80", and"#f80"are equivalent.
Alternatively, you can specify some common colors by name. This table lists the named color options, the equivalent RGB triplets, and hexadecimal color codes.
| Color Name | Short Name | RGB Triplet | Hexadecimal Color Code | Appearance |
|---|---|---|---|---|
"red" | "r" | [1 0 0] | "#FF0000" |
|
"green" | "g" | [0 1 0] | "#00FF00" |
|
"blue" | "b" | [0 0 1] | "#0000FF" |
|
"cyan"
| "c" | [0 1 1] | "#00FFFF" |
|
"magenta" | "m" | [1 0 1] | "#FF00FF" |
|
"yellow" | "y" | [1 1 0] | "#FFFF00" |
|
"black" | "k" | [0 0 0] | "#000000" |
|
"white" | "w" | [1 1 1] | "#FFFFFF" |
|
Here are the RGB triplets and hexadecimal color codes for the default colors MATLAB® uses in many types of plots.
| RGB Triplet | Hexadecimal Color Code | Appearance |
|---|---|---|
[0 0.4470 0.7410] | "#0072BD" |
|
[0.8500 0.3250 0.0980] | "#D95319" |
|
[0.9290 0.6940 0.1250] | "#EDB120" |
|
[0.4940 0.1840 0.5560] | "#7E2F8E" |
|
[0.4660 0.6740 0.1880] | "#77AC30" |
|
[0.3010 0.7450 0.9330] | "#4DBEEE" |
|
[0.6350 0.0780 0.1840] | "#A2142F" |
|
Line style, specified as one of the options listed in this table.
| Line Style | Description | Resulting Line |
|---|---|---|
"-" | Solid line |
|
"--" | Dashed line |
|
":" | Dotted line |
|
"-." | Dash-dotted line |
|
"none" | No line | No line |
Face color, specified as one of the values in this table.
| Value | Description |
|---|---|
'flat' | Use a different color for each face based on the values
in the
|
'interp' |
Use interpolated coloring for each face based on the values in the
|
| RGB triplet, hexadecimal color code, or color name |
Use the specified color for all the faces. This option does not use the color
values in the
|
'texturemap' | Transform the color data in CData so that
it conforms to the surface. |
'none' | Do not draw the faces. |
RGB triplets and hexadecimal color codes are useful for specifying custom colors.
An RGB triplet is a three-element row vector whose elements specify the intensities of the red, green, and blue components of the color. The intensities must be in the range
[0,1]; for example,[0.4 0.6 0.7].A hexadecimal color code is a character vector or a string scalar that starts with a hash symbol (
#) followed by three or six hexadecimal digits, which can range from0toF. The values are not case sensitive. Thus, the color codes"#FF8800","#ff8800","#F80", and"#f80"are equivalent.
Alternatively, you can specify some common colors by name. This table lists the named color options, the equivalent RGB triplets, and hexadecimal color codes.
| Color Name | Short Name | RGB Triplet | Hexadecimal Color Code | Appearance |
|---|---|---|---|---|
"red" | "r" | [1 0 0] | "#FF0000" |
|
"green" | "g" | [0 1 0] | "#00FF00" |
|
"blue" | "b" | [0 0 1] | "#0000FF" |
|
"cyan"
| "c" | [0 1 1] | "#00FFFF" |
|
"magenta" | "m" | [1 0 1] | "#FF00FF" |
|
"yellow" | "y" | [1 1 0] | "#FFFF00" |
|
"black" | "k" | [0 0 0] | "#000000" |
|
"white" | "w" | [1 1 1] | "#FFFFFF" |
|
Here are the RGB triplets and hexadecimal color codes for the default colors MATLAB uses in many types of plots.
| RGB Triplet | Hexadecimal Color Code | Appearance |
|---|---|---|
[0 0.4470 0.7410] | "#0072BD" |
|
[0.8500 0.3250 0.0980] | "#D95319" |
|
[0.9290 0.6940 0.1250] | "#EDB120" |
|
[0.4940 0.1840 0.5560] | "#7E2F8E" |
|
[0.4660 0.6740 0.1880] | "#77AC30" |
|
[0.3010 0.7450 0.9330] | "#4DBEEE" |
|
[0.6350 0.0780 0.1840] | "#A2142F" |
|
Extended Capabilities
Version History
Introduced before R2006a
See Also
Functions
Properties
You can also select a web site from the following list:
Americas
- América Latina (Español)
- Canada (English)
- United States (English)
Europe
- Belgium (English)
- Denmark (English)
- Deutschland (Deutsch)
- España (Español)
- Finland (English)
- France (Français)
- Ireland (English)
- Italia (Italiano)
- Luxembourg (English)
- Netherlands (English)
- Norway (English)
- Österreich (Deutsch)
- Portugal (English)
- Sweden (English)
- Switzerland
- United Kingdom (English)