title
Add title
Syntax
Description
title( adds the specified
title to the current axes or standalone visualization. Reissuing the
titletext)title command causes the new title to replace the old
title.
title(
adds a subtitle underneath the title.titletext,subtitletext)
title(___,
modifies the title appearance using one or more name-value pair arguments. For
example, Name,Value)'FontSize',12 sets the font size to 12 points. Specify
name-value pair arguments after all other input arguments. Modifying the title
appearance is not supported for all types of charts.
t = title(___)t to make future modifications to
the title.
Examples
Add Title to Current Axes
Create a figure and display a title in the current axes.
plot((1:10).^2)
title('My Title')
You also can call title with a function that returns text. For example, the date function returns text with today's date.
title(date)

MATLAB® sets the output of date as the axes title.
Create Title and Subtitle
Create a plot. Then create a title and a subtitle by calling the title function with two character vectors as arguments. Use the 'Color' name-value pair argument to customize the color for both lines of text. Specify two return arguments to store the text objects for the title and subtitle.
plot([0 1])
[t,s] = title('Straight Line','Slope = 1, y-Intercept = 0',...
    'Color','blue');

Change the font size for the title to 16, and change the font angle for the subtitle to 'italic'.
t.FontSize = 16;
s.FontAngle = 'italic';
Include Variable's Value in Title
Include the value of variable c in a title.
figure
plot((1:10).^2)
f = 70;
c = (f-32)/1.8;
title(['Temperature is ',num2str(c),' C'])

Create Multicolored Title Using TeX Markup
Use the color modifier \color to change the color of characters following it from the previous color.
plot((1:10).^2)
title(['\fontsize{16}black {\color{magenta}magenta '...
'\color[rgb]{0 .5 .5}teal \color{red}red} black again'])

Create Title with LaTeX Markup
Create a plot, and define t as a character vector that includes LaTeX markup. Surround the markup with dollar signs ($). Then pass t to the title function, and set the Interpreter property to 'latex'.
x = 0:0.1:10;
y = sin(x);
dy = cos(x);
plot(x,y,x,dy);
t = '$sin(x)$ and $\frac{d}{dx}sin(x)$';
title(t,'interpreter','latex')

Create Colored Title Using Name,Value Pair Argument
Use the Name,Value pair 'Color','m' to set the color of the title to magenta.
figure
plot((1:10).^2)
title('Case number # 3','Color', 'm')

Include Greek Symbols in Title
Use TeX markup to include Greek symbols in a title.
t = (0:0.01:0.2);
y = exp(-25*t);
figure
plot(t,y)
title('y = \ite^{\lambda t}','Color','b')

The 'Interpreter' property must be 'tex' (the default).
Include Superscript or Subscript Character in Title
figure
plot((1:10).^2)
title('\alpha^2 and X_1')
The superscript character, "^", and the subscript character, "_", modify the character or substring defined in braces immediately following.
Create Multiline Title
Create a multiline title using a multiline cell array.
figure
plot((1:10).^2)
title({'First line';'Second line'})
Display Text As Typed
Set the Interpreter property as 'none' so that the text X_1 is displayed in the figure as typed, without making 1 a subscript of X.
plot((1:10).^2)
title('X_1','Interpreter','none')

Add Title to Specific Axes
Starting in R2019b, you can display a tiling of plots using the tiledlayout and nexttile functions. Call the tiledlayout function to create a 2-by-1 tiled chart layout. Call the nexttile function to create the axes objects ax1 and ax2. Then plot data into each axes.
tiledlayout(2,1)
ax1 = nexttile;
plot(ax1,(1:10).^2)
ax2 = nexttile;
plot(ax2,(1:10).^3)

Add a title to each axes by passing ax1 and ax2 to the title function.
title(ax1,'Top Plot')
title(ax2,'Bottom Plot')

Add Title and Return Text Handle
Add a title to a plot and return the text object.
plot((1:10).^2)
t = title('My Title');
Set the color of the title to red. Use dot notation to set properties.
t.Color = 'red';
Change Title Alignment
Create a plot with a title. Get the current axes, and then align the title to the left edge of the plot box by setting the TitleHorizontalAlignment property of the axes to 'left'.
plot([0 2],[1 5])
title('Straight Line')
ax = gca;
ax.TitleHorizontalAlignment = 'left';

Center the title setting the TitleHorizontalAlignment property on the axes to 'center'.
ax.TitleHorizontalAlignment = 'center';
Input Arguments
titletext — Title text
'' (default) | character vector | cell array of character vectors | string array | categorical array | numeric value
Title text, specified as a character vector, cell array of character vectors, string array, categorical array, or numeric value. Specify a value according to how you want the text to appear. This table lists the most common situations.
| Appearance of Text | Description of Value | Example |
|---|---|---|
| One line of text | Character vector or string scalar. | txt = 'My Text'txt = "My Text" |
| Multiple lines of text | Cell array of character vectors or string array. | txt = {'First line','Second line'};txt = ["First line", "Second line"]; |
| Text that includes a numeric variable | Array that includes the number converted to a
char array. Use num2str
to convert the value. |
x = 42;
txt = ['The value is ',num2str(x)]; |
| Text that includes special characters such as Greek letters or mathematical symbols | Array that includes TeX markup. For a list of
supported markup, see the
Interpreter property. |
txt = 'x ranges from 0 to 2\pi' |
Note
The words
default,factory, andremoveare reserved words that do not appear in text when quoted as normal characters. To display any of these words individually, precede them with a backslash, such as'\default'or'\remove'.If you specify this property as a categorical array, MATLAB® uses the values in the array, not the categories.
If you specify text that contains only a numeric value, the value is converted using
sprintf('%g',value). For example,12345678displays as1.23457e+07.
subtitletext — Subtitle text
'' (default) | character vector | cell array of character vectors | string array | categorical array | numeric value
Subtitle text, specified as a character vector, cell array of character vectors, string array, categorical array, or numeric value. Specify a value according to how you want the text to appear. This table lists the most common situations.
| Appearance of Text | Description of Value | Example |
|---|---|---|
| One line of text | Character vector or string scalar. | txt = 'My Text'txt = "My Text" |
| Multiple lines of text | Cell array of character vectors or string array. | txt = {'First line','Second line'};txt = ["First line", "Second line"]; |
| Text that includes a numeric variable | Array that includes the number converted to a
char array. Use num2str
to convert the value. |
x = 42;
txt = ['The value is ',num2str(x)]; |
| Text that includes special characters such as Greek letters or mathematical symbols | Array that includes TeX markup. For a list of
supported markup, see the
Interpreter property. |
txt = 'x ranges from 0 to 2\pi' |
Note
The words
default,factory, andremoveare reserved words that do not appear in text when quoted as normal characters. To display any of these words individually, precede them with a backslash, such as'\default'or'\remove'.If you specify this property as a categorical array, MATLAB uses the values in the array, not the categories.
If you specify text that contains only a numeric value, the value is converted using
sprintf('%g',value). For example,12345678displays as1.23457e+07.
target — Target for title
axes | legend | tiled chart layout | standalone visualization | array of objects
Target for the title, specified as one of the following:
Any type of axes: an
Axes,PolarAxes, orGeographicAxesobject.Any type of legend: a
LegendorBubbleLegendobject.A
TiledChartLayoutobject.A standalone visualization that has a
Titleproperty. For example, you can add a title to aHeatmapChartobject.An array of graphics objects from the preceding list. The objects must belong to the same class. To determine the class, use the
classfunction.
If you do not specify the target for the title, then the title function
adds the title to the graphics object returned by the gca command.
Note
Some charts do not support modifying the title appearance, such as the color, or returning the text object as an output argument.
Name-Value Arguments
Specify optional pairs of arguments as
Name1=Value1,...,NameN=ValueN, where Name is
the argument name and Value is the corresponding value.
Name-value arguments must appear after other arguments, but the order of the
pairs does not matter.
Before R2021a, use commas to separate each name and value, and enclose
Name in quotes.
Example: 'Color','red','FontSize',14 adds
a title with red, 14-point font.
In addition to the following, you can specify other text object
properties using Name,Value pair arguments. See Text Properties.
FontSize — Font size
11 (default) | scalar value greater than 0
Font size, specified as a scalar value greater than 0 in point units. One point equals 1/72 inch. To change the font units, use the FontUnits property.
If you add a title or subtitle to an axes object, then the font size property for the axes
also affects the font size for the title and subtitle. The title and subtitle font sizes
are the axes font size multiplied by a scale factor. The FontSize property of the axes
contains the axes font size. The TitleFontSizeMultiplier property of the axes contains the scale factor.
By default, the axes font size is 10 points and the scale factor is 1.1, so the title
and subtitle each have a font size of 11 points.
Data Types: single | double | int8 | int16 | int32 | int64 | uint8 | uint16 | uint32 | uint64
FontWeight — Thickness of text characters
'normal' | 'bold'
Thickness of the text characters, specified as one of these values:
'normal'— Normal weight as defined by the particular font'bold'— Thicker characters outlines than normal
MATLAB uses the FontWeight property
to select a font from those available on your system. Not all fonts
have a bold font weight. Therefore, specifying a bold font weight
could still result in the normal font weight.
The TitleFontWeight property for the associated axes affects
the FontWeight value for the title. Similarly, the
SubtitleFontWeight property for the associated axes
affects the FontWeight value for the subtitle.
Note
The 'light' and 'demi' font
weight values have been removed. Use 'normal' instead.
Text color, specified as an RGB triplet, a hexadecimal color code, a color name, or a short
name. The default value of [0 0 0] corresponds to black.
For a custom color, specify an RGB triplet or a hexadecimal color code.
An RGB triplet is a three-element row vector whose elements specify the intensities of the red, green, and blue components of the color. The intensities must be in the range
[0,1], for example,[0.4 0.6 0.7].A hexadecimal color code is a string scalar or character vector that starts with a hash symbol (
#) followed by three or six hexadecimal digits, which can range from0toF. The values are not case sensitive. Therefore, the color codes"#FF8800","#ff8800","#F80", and"#f80"are equivalent.
Alternatively, you can specify some common colors by name. This table lists the named color options, the equivalent RGB triplets, and hexadecimal color codes.
| Color Name | Short Name | RGB Triplet | Hexadecimal Color Code | Appearance |
|---|---|---|---|---|
"red" | "r" | [1 0 0] | "#FF0000" |
|
"green" | "g" | [0 1 0] | "#00FF00" |
|
"blue" | "b" | [0 0 1] | "#0000FF" |
|
"cyan"
| "c" | [0 1 1] | "#00FFFF" |
|
"magenta" | "m" | [1 0 1] | "#FF00FF" |
|
"yellow" | "y" | [1 1 0] | "#FFFF00" |
|
"black" | "k" | [0 0 0] | "#000000" |
|
"white" | "w" | [1 1 1] | "#FFFFFF" |
|
"none" | Not applicable | Not applicable | Not applicable | No color |
Here are the RGB triplets and hexadecimal color codes for the default colors MATLAB uses in many types of plots.
| RGB Triplet | Hexadecimal Color Code | Appearance |
|---|---|---|
[0 0.4470 0.7410] | "#0072BD" |
|
[0.8500 0.3250 0.0980] | "#D95319" |
|
[0.9290 0.6940 0.1250] | "#EDB120" |
|
[0.4940 0.1840 0.5560] | "#7E2F8E" |
|
[0.4660 0.6740 0.1880] | "#77AC30" |
|
[0.3010 0.7450 0.9330] | "#4DBEEE" |
|
[0.6350 0.0780 0.1840] | "#A2142F" |
|
Example: 'blue'
Example: [0
0 1]
Example: '#0000FF'
Text interpreter, specified as one of these values:
'tex'— Interpret characters using a subset of TeX markup.'latex'— Interpret characters using LaTeX markup.'none'— Display literal characters.
TeX Markup
By default, MATLAB supports a subset of TeX markup. Use TeX markup to add superscripts and subscripts, modify the font type and color, and include special characters in the text.
Modifiers remain in effect until the end of the text.
Superscripts and subscripts are an exception because they modify only the next character or the
characters within the curly braces. When you set the interpreter to 'tex',
the supported modifiers are as follows.
| Modifier | Description | Example |
|---|---|---|
^{ } | Superscript | 'text^{superscript}' |
_{ } | Subscript | 'text_{subscript}' |
\bf | Bold font | '\bf text' |
\it | Italic font | '\it text' |
\sl | Oblique font (usually the same as italic font) | '\sl text' |
\rm | Normal font | '\rm text' |
\fontname{ | Font name — Replace
| '\fontname{Courier} text' |
\fontsize{ | Font size —Replace
| '\fontsize{15} text' |
\color{ | Font color — Replace
red, green,
yellow, magenta,
blue, black,
white, gray,
darkGreen, orange, or
lightBlue. | '\color{magenta} text' |
\color[rgb]{specifier} | Custom font color — Replace
| '\color[rgb]{0,0.5,0.5} text' |
This table lists the supported special characters for the
'tex' interpreter.
| Character Sequence | Symbol | Character Sequence | Symbol | Character Sequence | Symbol |
|---|---|---|---|---|---|
| α |
| υ |
| ~ |
| ∠ |
| ϕ |
| ≤ |
|
|
| χ |
| ∞ |
| β |
| ψ |
| ♣ |
| γ |
| ω |
| ♦ |
| δ |
| Γ |
| ♥ |
| ϵ |
| Δ |
| ♠ |
| ζ |
| Θ |
| ↔ |
| η |
| Λ |
| ← |
| θ |
| Ξ |
| ⇐ |
| ϑ |
| Π |
| ↑ |
| ι |
| Σ |
| → |
| κ |
| ϒ |
| ⇒ |
| λ |
| Φ |
| ↓ |
| µ |
| Ψ |
| º |
| ν |
| Ω |
| ± |
| ξ |
| ∀ |
| ≥ |
| π |
| ∃ |
| ∝ |
| ρ |
| ∍ |
| ∂ |
| σ |
| ≅ |
| • |
| ς |
| ≈ |
| ÷ |
| τ |
| ℜ |
| ≠ |
| ≡ |
| ⊕ |
| ℵ |
| ℑ |
| ∪ |
| ℘ |
| ⊗ |
| ⊆ |
| ∅ |
| ∩ |
| ∈ |
| ⊇ |
| ⊃ |
| ⌈ |
| ⊂ |
| ∫ |
| · |
| ο |
| ⌋ |
| ¬ |
| ∇ |
| ⌊ |
| x |
| ... |
| ⊥ |
| √ |
| ´ |
| ∧ |
| ϖ |
| ∅ |
| ⌉ |
| 〉 |
| | |
| ∨ |
| 〈 |
| © |
LaTeX Markup
To use LaTeX markup, set the interpreter to 'latex'. For inline
mode, surround the markup with single dollar signs ($). For
display mode, surround the markup with double dollar signs
($$).
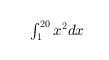
| LaTeX Mode | Example | Result |
|---|---|---|
| Inline |
'$\int_1^{20} x^2 dx$' |
|
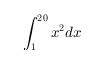
| Display |
'$$\int_1^{20} x^2 dx$$' |
|
The displayed text uses the default LaTeX font style. The
FontName, FontWeight, and
FontAngle properties do not have an effect. To change the
font style, use LaTeX markup.
The maximum size of the text that you can use with the LaTeX interpreter is 1200 characters. For multiline text, this reduces by about 10 characters per line.
For examples that use TeX and LaTeX, see Greek Letters and Special Characters in Chart Text. For more information about the LaTeX system, see The LaTeX Project website at https://www.latex-project.org/.
Output Arguments
Tips
By default, the
Interactionsproperty containseditInteractionso the text can be edited by clicking on the text. To disable this interaction, set theInteractionsproperty of the text object to[].
Version History
Introduced before R2006a
See Also
Functions
Properties
You can also select a web site from the following list:
Americas
- América Latina (Español)
- Canada (English)
- United States (English)
Europe
- Belgium (English)
- Denmark (English)
- Deutschland (Deutsch)
- España (Español)
- Finland (English)
- France (Français)
- Ireland (English)
- Italia (Italiano)
- Luxembourg (English)
- Netherlands (English)
- Norway (English)
- Österreich (Deutsch)
- Portugal (English)
- Sweden (English)
- Switzerland
- United Kingdom (English)