distributionFitter
Open Distribution Fitter app
Syntax
Description
This page contains programmatic syntax information for the Distribution Fitter app. For general usage information, see Distribution Fitter.
distributionFitter opens the Distribution
Fitter app, or brings focus to the app if it is already open.
distributionFitter( opens
the Distribution Fitter app populated with the data specified by the
vector y)y.
Examples
Open Distribution Fitter App with Existing Data
Load the carsmall sample data.
load carsmallOpen the Distribution Fitter app using the MPG miles per gallon data.
distributionFitter(MPG)
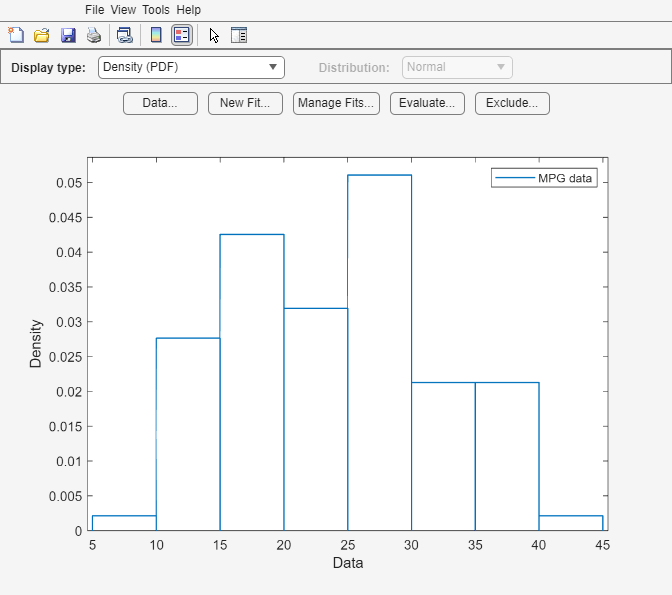
The Distribution Fitter app opens, populated with the MPG data, and displays the density (PDF) plot. You can use the app to display different plots and fit distributions to this data.
Open Distribution Fitter App with Censoring Data
Load the sample data.
load lightbulb.matThe first column of the data contains the lifetime (in hours) of two types of light bulbs. The second column contains information about the type of light bulb. 1 indicates fluorescent bulbs, and 0 indicates the incandescent bulb. The third column contains censoring information. 1 indicates censored data, and 0 indicates the exact failure time. This is simulated data.
Open the Distribution Fitter app using the first column of lightbulb as the input data, and the third column as the censoring data. Name the data lifetime.
distributionFitter(lightbulb(:,1),lightbulb(:,3),[],"lifetime")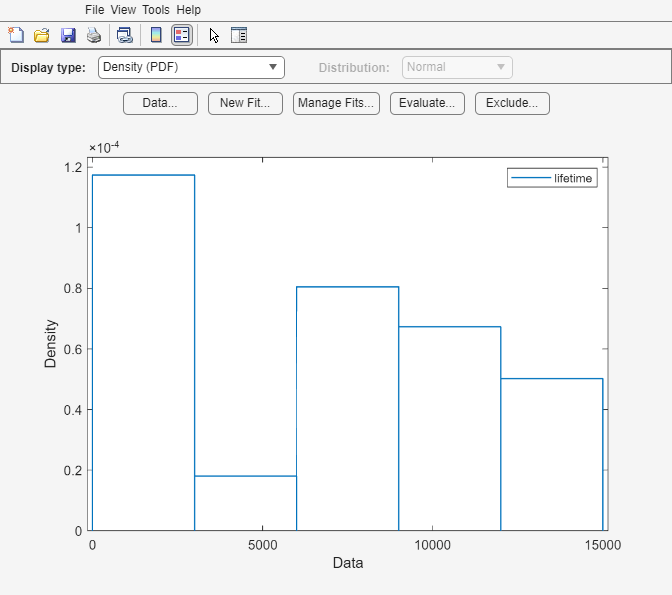
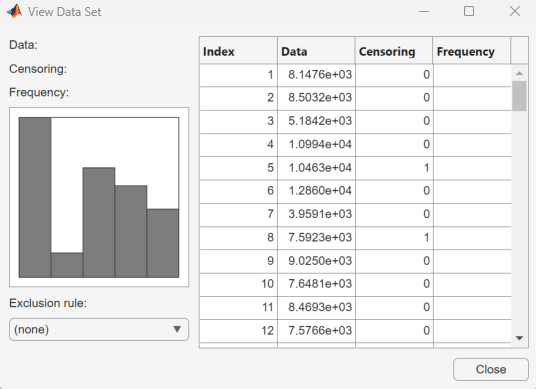
To open the Data dialog box, click Data. In the Manage data sets pane, click to highlight the lifetime data set row. Finally, to open the View Data Set dialog box, click View. The lifetime data appears in the second column and the corresponding censoring indicator appears in the third column.
Input Arguments
Version History
Introduced before R2006aYou can also select a web site from the following list:
Americas
- América Latina (Español)
- Canada (English)
- United States (English)
Europe
- Belgium (English)
- Denmark (English)
- Deutschland (Deutsch)
- España (Español)
- Finland (English)
- France (Français)
- Ireland (English)
- Italia (Italiano)
- Luxembourg (English)
- Netherlands (English)
- Norway (English)
- Österreich (Deutsch)
- Portugal (English)
- Sweden (English)
- Switzerland
- United Kingdom (English)