contourslice
Draw contours in volume slice planes
Syntax
Description
contourslice(draws
contours in slices for the volumetric data X,Y,Z,V,xslice,yslice,zslice) V, where
V determines the contour colors. Specify
X,Y, and Z as the
coordinate data. Specify xslice, yslice,
and zslice as the slice locations using one of these forms:
To draw one or more slice planes that are orthogonal to a particular axis, specify the slice arguments as a scalar or vector.
To draw a single slice along a surface, specify all the slice arguments as matrices that define a surface.
contourslice(___,
specifies the number of contour lines to draw per slice. Use this option with any of
the input arguments from the previous syntaxes.num)
contourslice(___,
specifies the values at which to draw contour lines within each slice.lvls)
contourslice(___,
specifies the interpolation method, where method) method can be
'linear', 'cubic', or
'nearest'.
contourslice( plots
into the specified axes, instead of the current axes
(ax,___)gca).
s = contourslice(___)Patch objects created.
Examples
Draw Contours for Single Slice
Create a single slice plane through volumetric data and draw contours of the data values.
Create the matrices X, Y, Z, and V from the flow data set. Draw contours of V in the slice plane where z = 0.
[X,Y,Z,V] = flow;
zslice = 0;
contourslice(X,Y,Z,V,[],[],zslice)
grid on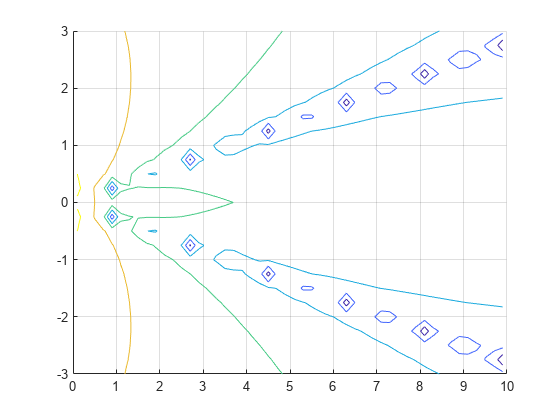
Draw Contours in Slice Planes
Create multiple slice planes through volumetric data. Draw contours of the data values in each of the slice planes. Let MATLAB choose the contour levels.
Create V as an array of volume data defined by . Draw contours in three slice planes that are orthogonal to the x-axis at the values -1.2, 0.8, and 2. Do not create any slice planes that are orthogonal to the y-axis or z-axis by specifying empty arrays. Change the axes view to a 3-D view and add grid lines.
[X,Y,Z] = meshgrid(-2:.2:2);
V = X.*exp(-X.^2-Y.^2-Z.^2);

xslice = [-1.2,0.8,2];
yslice = [];
zslice = [];
contourslice(X,Y,Z,V,xslice,yslice,zslice)
view(3)
grid on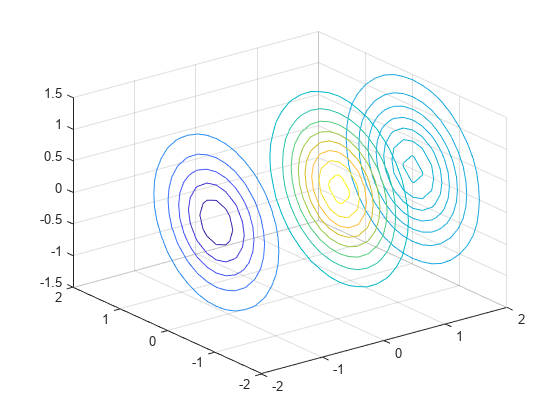
Specify Contour Levels and Add Colorbar
Create multiple slice planes through volumetric data. Draw contours of the data values in each of the slice planes. Specify the levels where you want to draw the contours. Then, add a colorbar.
Draw contours in three slice planes that are orthogonal to the x-axis at the values -1.2, 0.8, and 2. Draw contours for the volume data between the values -0.2 and 0.4, spaced every 0.01. Add a colorbar to see how the data values map to the contour colors. Also, change the axes view to a 3-D view and add grid lines.
[X,Y,Z] = meshgrid(-2:.2:2);
V = X.*exp(-X.^2-Y.^2-Z.^2);
xslice = [-1.2,0.8,2];
lvls = -0.2:0.01:0.4;

contourslice(X,Y,Z,V,xslice,[],[],lvls)
colorbar
view(3)
grid on
Draw Contours Along Surface Slice
Create a surface slice through volumetric data and draw contours along the surface of the volume data. Specify the number of contour levels to draw.
Create V as an array of volume data defined by . Then, show a slice of the volume data along the surface defined by . Draw 20 contours along the surface. Change the axes view to a 3-D view and add grid lines.
[X,Y,Z] = meshgrid(-5:0.2:5);
V = X.*exp(-X.^2-Y.^2-Z.^2);

[xsurf,ysurf] = meshgrid(-2:0.2:2);
zsurf = xsurf.^2-ysurf.^2;
contourslice(X,Y,Z,V,xsurf,ysurf,zsurf,20)
view(3)
grid on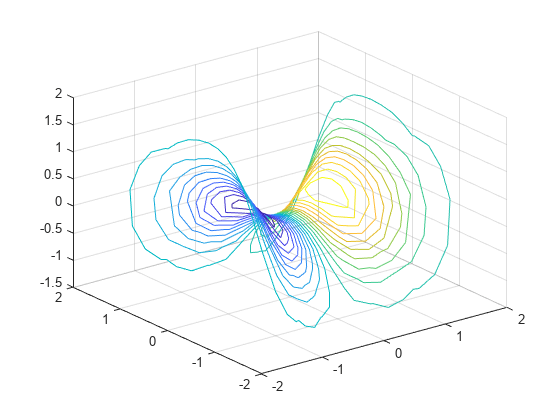
Input Arguments
Algorithms
The contourslice function does not clear existing plots before
plotting.
Extended Capabilities
Version History
Introduced before R2006a
See Also
meshgrid | slice | interp3 | contour | isosurface
You can also select a web site from the following list:
Americas
- América Latina (Español)
- Canada (English)
- United States (English)
Europe
- Belgium (English)
- Denmark (English)
- Deutschland (Deutsch)
- España (Español)
- Finland (English)
- France (Français)
- Ireland (English)
- Italia (Italiano)
- Luxembourg (English)
- Netherlands (English)
- Norway (English)
- Österreich (Deutsch)
- Portugal (English)
- Sweden (English)
- Switzerland
- United Kingdom (English)