Main Content

mode

Most frequent values in array

Description

example

M = mode(A) returns the sample mode of A, which is the most frequently occurring value in A. When there are multiple values occurring equally frequently, mode returns the smallest of those values. For complex inputs, the smallest value is the first value in a sorted list.

  • If A is a vector, then mode(A) returns the most frequent value of A.

  • If A is a nonempty matrix, then mode(A) returns a row vector containing the mode of each column of A.

  • If A is an empty 0-by-0 matrix, mode(A) returns NaN.

  • If A is a multidimensional array, then mode(A) treats the values along the first array dimension whose size does not equal 1 as vectors and returns an array of most frequent values. The size of this dimension becomes 1 while the sizes of all other dimensions remain the same.

  • If A is a table or timetable, then mode(A) returns a one-row table containing the mode of each variable. (since R2023a)

example

M = mode(A,'all') computes the mode over all elements of A. This syntax is valid for MATLAB® versions R2018b and later.

example

M = mode(A,dim) returns the mode of elements along dimension dim. For example, if A is a matrix, then mode(A,2) is a column vector containing the most frequent value of each row

example

M = mode(A,vecdim) computes the mode based on the dimensions specified in the vector vecdim. For example, if A is a matrix, then mode(A,[1 2]) is the mode over all elements in A, since every element of a matrix is contained in the array slice defined by dimensions 1 and 2.

example

[M,F] = mode(___) also returns a frequency array F, using any of the input arguments in the previous syntaxes. F is the same size as M, and each element of F represents the number of occurrences of the corresponding element of M.

example

[M,F,C] = mode(___) also returns a cell array C of the same size as M and F. Each element of C is a sorted vector of all values that have the same frequency as the corresponding element of M.

Examples

collapse all

Define a 3-by-4 matrix.

A = [3 3 1 4; 0 0 1 1; 0 1 2 4]
A = 3×4

     3     3     1     4
     0     0     1     1
     0     1     2     4

Find the most frequent value of each column.

M = mode(A)
M = 1×4

     0     0     1     4

Define a 3-by-4 matrix.

A = [3 3 1 4; 0 0 1 1; 0 1 2 4]
A = 3×4

     3     3     1     4
     0     0     1     1
     0     1     2     4

Find the most frequent value of each row.

M = mode(A,2)
M = 3×1

     3
     0
     0

Create a 1-by-3-by-4 array of integers between 1 and 10.

rng('default')
A = randi(10,[1,3,4])
A = 
A(:,:,1) =

     9    10     2


A(:,:,2) =

    10     7     1


A(:,:,3) =

     3     6    10


A(:,:,4) =

    10     2    10

Find the most frequent values of this 3-D array along the second dimension.

M = mode(A)
M = 
M(:,:,1) =

     2


M(:,:,2) =

     1


M(:,:,3) =

     3


M(:,:,4) =

    10

This operation produces a 1-by-1-by-4 array by finding the most frequent value along the second dimension. The size of the second dimension reduces to 1.

Compute the mode along the first dimension of A.

M = mode(A,1);
isequal(A,M)
ans = logical
   1

This returns the same array as A because the size of the first dimension is 1.

Create a 3-D array and compute the mode over each page of data (rows and columns).

A(:,:,1) = [2 4; 2 1];
A(:,:,2) = [6 2; 3 3];
A(:,:,3) = [4 4; 7 4];
M1 = mode(A,[1 2])
M1 = 
M1(:,:,1) =

     2


M1(:,:,2) =

     3


M1(:,:,3) =

     4

Starting in R2018b, to compute the mode over all dimensions of an array, you can either specify each dimension in the vector dimension argument, or use the 'all' option.

M2 = mode(A,[1 2 3])
M2 = 4
Mall = mode(A,'all')
Mall = 4

Define a 3-by-4 matrix.

A = [3 3 1 4; 0 0 1 1; 0 1 2 4]
A = 3×4

     3     3     1     4
     0     0     1     1
     0     1     2     4

Find the most frequent value of each column, as well as how often it occurs.

[M,F] = mode(A)
M = 1×4

     0     0     1     4

F = 1×4

     2     1     2     2

F(1) is 2 since M(1) occurs twice in the first column.

Define a 3-by-4 matrix.

A = [3 3 1 4; 0 0 1 1; 0 1 2 4]
A = 3×4

     3     3     1     4
     0     0     1     1
     0     1     2     4

Find the most frequent value of each row, how often it occurs, and which values in that row occur with the same frequency.

[M,F,C] = mode(A,2)
M = 3×1

     3
     0
     0

F = 3×1

     2
     2
     1

C=3×1 cell array
    {[       3]}
    {2x1 double}
    {4x1 double}

C{2} is the 2-by-1 vector [0;1] since values 0 and 1 in the second row occur with frequency F(2).

C{3} is the 4-by-1 vector [0;1;2;4] since all values in the third row occur with frequency F(3).

Define a 1-by-4 vector of 16-bit unsigned integers.

rng('default')
A = randi(10,[1,4],'uint16')
A = 1x4 uint16 row vector

    9   10    2   10

Find the most frequent value, as well as the number of times it occurs.

[M,F] = mode(A)
M = uint16
    10
F = 2
class(M)
ans = 
'uint16'

M is the same class as the input, A.

Input Arguments

collapse all

Input array, specified as a vector, matrix, multidimensional array, table, or timetable. A can be a numeric array, categorical array, datetime array, duration array, or a table or timetable whose variables have any of those data types.

NaN or NaT (Not a Time) values in the input array, A, are ignored. Undefined values in categorical arrays are similar to NaNs in numeric arrays.

Dimension to operate along, specified as a positive integer scalar. If you do not specify the dimension, then the default is the first array dimension of size greater than 1.

Dimension dim indicates the dimension whose length reduces to 1. The size(M,dim) is 1, while the sizes of all other dimensions remain the same.

Consider an m-by-n input matrix, A:

  • mode(A,1) computes the mode of the elements in each column of A and returns a 1-by-n row vector.

    mode(A,1) column-wise operation

  • mode(A,2) computes the mode of the elements in each row of A and returns an m-by-1 column vector.

    mode(A,2) row-wise operation

mode returns A if dim is greater than ndims(A).

Vector of dimensions, specified as a vector of positive integers. Each element represents a dimension of the input array. The lengths of the output in the specified operating dimensions are 1, while the others remain the same.

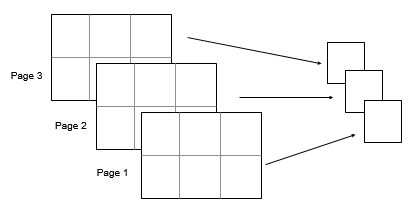
Consider a 2-by-3-by-3 input array, A. Then mode(A,[1 2]) returns a 1-by-1-by-3 array whose elements are the modes of each page of A.

Mapping of a 2-by-3-by-3 input array to a 1-by-1-by-3 output array

Output Arguments

collapse all

Most frequent values returned as a scalar, vector, matrix, multidimensional array, or table. When there are multiple values occurring equally frequently, mode returns the smallest of those values. For complex inputs, this is taken to be the first value in a sorted list of values.

If the input A is an array, then the output M is an array of the same class.

If A is a table or timetable, then M is a one-row table. If the variables of A have units, then the variables of M have the same units.

Frequency array returned as a scalar, vector, matrix, multidimensional array or table. The size of F is the same as the size of M, and each element of F represents the number of occurrences of the corresponding element of M.

If the input A is an array, then the output F is a double array.

If A is a table or timetable, then F is a one-row table. If the variables of A have units, then the variables of F do not have those units.

Most frequent values with multiplicity returned as a cell array or table. The size of C is the same as the size of M and F, and each element of C is a sorted column vector of all values that have the same frequency as the corresponding element of M.

If the input A is a table or timetable, then the output C is a one-row table. Each variable of C has a cell array that contains a sorted column vector of all values that have the same frequency as the corresponding element of M. If the variables of A have units, then the variables of C have the same units.

Tips

  • The mode function is most useful with discrete or coarsely rounded data. The mode for a continuous probability distribution is defined as the peak of its density function. Applying the mode function to a sample from that distribution is unlikely to provide a good estimate of the peak; it would be better to compute a histogram or density estimate and calculate the peak of that estimate. Also, the mode function is not suitable for finding peaks in distributions having multiple modes.

Extended Capabilities

Version History

Introduced before R2006a

expand all