rgbplot
Plot colormap
Syntax
Description
Examples
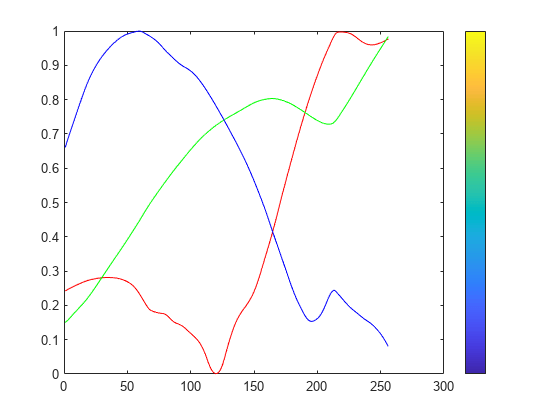
Plot a Predefined Colormap
Plot the parula colormap, and display a colorbar as a visual reference.
rgbplot(parula)
hold on
colormap(parula)
colorbar('Ticks',[])
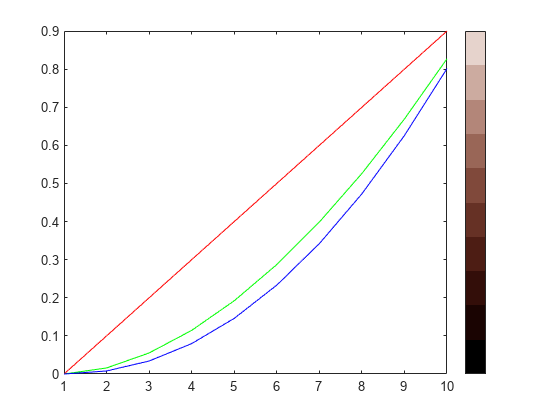
Plot a Custom Colormap
Create a custom colormap and plot it. Then display a colorbar as a visual reference.
r = (0:.1:.9)';
g = r.^1.8;
b = r.^2.1;
mymap = [r g b];
rgbplot(mymap)
hold on
colormap(mymap)
colorbar('Ticks',[])
Input Arguments
Version History
Introduced before R2006a
See Also
You can also select a web site from the following list:
Americas
- América Latina (Español)
- Canada (English)
- United States (English)
Europe
- Belgium (English)
- Denmark (English)
- Deutschland (Deutsch)
- España (Español)
- Finland (English)
- France (Français)
- Ireland (English)
- Italia (Italiano)
- Luxembourg (English)
- Netherlands (English)
- Norway (English)
- Österreich (Deutsch)
- Portugal (English)
- Sweden (English)
- Switzerland
- United Kingdom (English)